Surface Residue Reduces Overwinter Evaporation
Chapter 3 — Residue Management, No. 14, Fall 1989
Roger Veseth
Available water is one of the major yield-limiting factors under dryland cropping in the Northwest. Since about 60 to 75 percent of the annual precipitation, in much of the Northwest, occurs between October and April, this is a critical time for producers to concentrate their management efforts on improving water storage efficiency by reducing surface runoff and evaporation. Available water has often been taken for granted as an uncontrollable variable caused by the climatic factors during the water storage period. However, Northwest research has demonstrated that management can significantly affect the amount of water available for the crop.
Without adequate surface residue on sloping cropland, runoff is usually accompanied by soil erosion as a visible reminder of that water loss. Producers realize that yield potential has also been lost with the runoff water, though seldom to what extent. In contrast, there is little visual evidence of soil water loss from evaporation.
Evaporative loss under different tillage and residue management systems has also been difficult to quantify and predict in a field situation. Field research on overwinter water storage has demonstrated some significant differences due to management. However, it has often been difficult to determine what portion of the differences should be attributed to evaporation and what portion attributed to runoff.
Recently, computer modeling has begun to provide a useful tool in estimating precipitation losses by evaporation, as well as runoff and deep percolation. It is being explored as part of a larger effort in modeling the effects of management practices on crop production and soil and water resources,
Much of the field and computer modeling research in this area has been conducted under the STEEP (Solutions To Environmental and Economic Problems) program, Since 1975, this has been a portion of a large cooperative research effort on conservation farming that has involved more than 100 USDA-Agricultural Research Service (ARS) and land-grant university scientists from at least 14 different disciplines in Idaho, Washington and Oregon.
This paper will briefly explore some examples of estimated evaporative water loss from Northwest cropland through both field research and computer simulations.
Water-Yield Potential Relationship
As an introduction to this topic, it is important to point out that relatively accurate predictive relationships have been established between available water and yield potential. For cereals, about 4 inches of water is generally required to grow the crop plant to the initial yield point. Additional water, above the initial 4 inches to produce the plant, then produces cereal grain. For winter wheat, the yield response is typically from 5 to 7 bushels/acre for each inch of available water. Spring wheat is slightly lower at 4 to 6 bushels/acre/inch. Barley is higher at 8 to 10 bushels/acre/inch. In addition to yield, crop water use is also closely correlated with total dry matter production, which is useful for predicting the amount of crop residue produced.
Besides the total available water, it must be pointed out that other climatic and production factors also influence yield potential and can alter the water-yield potential relationship. These include: distribution of precipitation, particularly during growing season; length of growing season; accumulated heat (measured as “growing degree days”) between planting and grain formation; genetic potential of the variety; competition for water, nutrients and light from weeds and within the crop itself soil fertility, aeration, compaction and other properties and conditions affecting plant growth; damage from diseases and pests; and other factors. With these additional yield-influencing factors in mind, producers can utilize the established water-yield potential relationships to develop management strategies for optimizing yield with available water.
Field Research Example
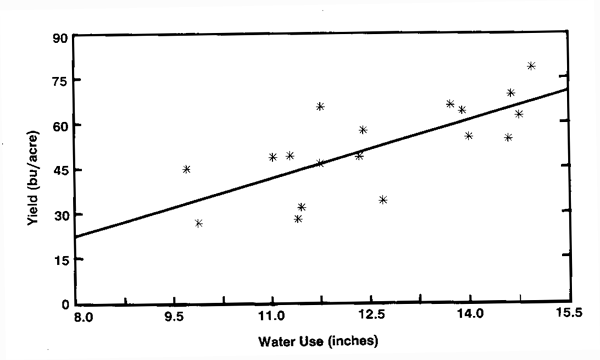
An example of the water-yield potential relationship is shown in some recent research by Keith Saxton, USDA-Agricultural Research Service (ARS) agricultural engineer and STEEP researcher. The research was conducted in a 20-inch precipitation zone near Pullman, WA, Winter wheat yield increased an average of 6.2 bushels/acre/inch of available water used by the crop from early spring to harvest in 1988 (Fig. 1) under a variety of different crop rotations and tillage practices. As shown by the variability in actual yield/acre/inch of water, the effective use of the available water was probably influenced to some degree by treatment differences in weed populations, disease infestations and other factors mentioned earlier.

Field Research Examples Of Evaporation Loss
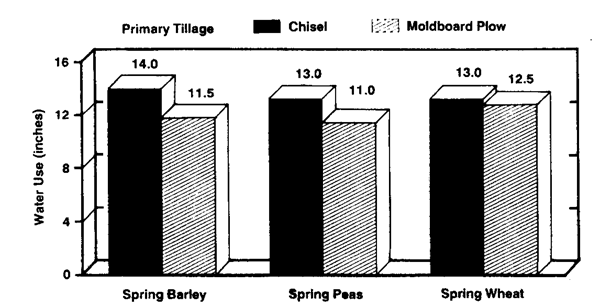
From the research site previously mentioned, Saxton’s research results showed that overwinter water storage and water use by winter wheat under three different crop rotations where higher where the chisel was used for primary tillage compared to the moldboard plow (Fig. 2). Saxton points out that the winter wheat dried the soil to the same soil water content by harvest under all the rotations and tillage treatments. Consequently, differences in water use from April 1 to harvest largely reflect differences in previous crop water use, overwinter soil water storage under contrasting surface residue levels with the two tillage systems, and runoff and evaporative losses. Water loss by surface runoff was considered negligible. The chisel-based tillage system, which left significantly more residue on the surface, resulted in 0.5 to 2.5 inches of additional available water which resulted in approximately 3 to 15 bushels/acre higher yields than the plow based system in the three crop rotations,
The chisel-based tillage operations for planting winter wheat after barley or spring wheat were: standard chisel/field cultivator (2X)/double disk drill. An estimated 35 percent of the original cereal residue remained on the surface after seeding. After chiseling of the pea stubble, one field cultivator operation was used before seeding. About 55 percent of the pea residue remained on the surface after seeding.
The plow-based tillage operations for winter wheat after cereals and peas were: moldboard plow/disk/field cultivator/double disk drill. An estimated 5 percent of the original residue remained on the surface after seeding winter wheat after cereals and less than 2 percent after peas.

Data from 1987-88 at the study site indicated that fall chiseling of winter wheat stubble resulted in an average 1 to 3 inches more overwinter water storage for the spring crop than with fall plowing. These diffe~nces in water storage were attributed mostly to differences in evaporation.
Winona, WA
Saxton also documented a substantial increase in storage of over vvinter precipitation in a lower precipitation zone with standing cereal stubble compared to a bare surface after fall stubble burning (Table 1). The field research site was near Winona, WA, 30 miles west of Colfax, in a 16-inch precipitation zone.
The Paraplow (now marketed as Paratill by The Tye Company) was also evaluated on both treatments. It is somewhat similar to a moldboard plow except that it does not invert the soil, leaving the soil surface and residue largely undisturbed. The purpose of the Paraplow is to fracture and loosen compacted surface and subsurface soil layers while maintaining surface residue. This allows increased water infiltration rates into the soil, which can result in reduced runoff and reduced evaporation of overwinter precipitation. Reduced soil resistance to root growth, and improved soil aeration and drainage can also promote more vigorous growth and reduce the impact of some root diseases.
Without fall Paraplowing, standing stubble increased water storage 2.3 inches compared to the burned, bare treatment. With Paraplowing, the increase in soil water storage with standing stubble was 2.7 inches. Paraplowing increased water storage an additional 1.5 inches in the standing stubble treatment and 1.1 inches in the bare treatment. Nearly 4 inches more water were stored with Paraplowed standing stubble compared to the bare treatment without Paraplowing.
Specific influences of surface runoff and evaporation on differences in increased soil water storage between the treatments were not determined. However, Saxton estimates that annual runoff losses from the plots overwinter averaged less than 0.5 inch.
Pendleton, OR
Another field research example is from Robert Ramig, USDA-ARS soil scientist and STEEP researcher, in a
Table 1. Average increases in soil water storage from November through March during 1983 through 1988 with standing cereal stubble compared to a bare surface both with and without the Paraplow near Winona, WA (Saxton, USDA-ARS).
| Residue Treatment 1 | Soil Water Storage 2 | |
|---|---|---|
| Fall Paraplow | No fall Paraplow | |
| Standing Stubble | 6.3 | 4.8 |
| Bare | 3.6 | 2.5 |
| l Spring barley in the fall of 1963 and 1985, winter wheat in the fall of 1984. 2 From November through March in top 6-foot soil profile. |
||
16-inch precipitation zone near Pendleton, OR. He measured a 1.4-inch average increase in overwinter soil water storage during a 20-year period (1968-88) with standing winter wheat stubble (about 6,000 pounds/acre) compared with fall plowing (about 200 pounds/acre left on the surface). The results are from a long-term winter wheat-green pea study at the USDA-ARS Columbia Plateau Conservation Research Center.
The research site was gentle sloping (O to 2 percent), so runoff was minimal and the difference in water storage was primarily attributed to reduced evaporation. Snow trapping by the stubble was also a factor in the increased water storage. The additional 1.4 inches of water increased yields of the green processing peas an average of 126 pounds/acre. Yield of the following wheat crops were also increased an average of 2.6 bushels/acre because the pea crops generally did not utilize all of the additional stored soil water.
Ramig also compared leaving winter wheat stubble stand overwinter to fall burning (to simulate lightning or harvest fires) for 5 years (1980-84). Research sites were located near Moro and Pendleton which receive 12 and 15 inches of mean annual precipitation, respectively. Where stubble remained standing overwinter, an average of 1.42 inches more water was stored in the soil profile at Moro than where the stubble had been burned in the fall. At Pendleton, the increase water storage with standing stubble averaged 1.31 inches. The differences in water storage were primarily attributed to evaporation
Computer Modeling of Evaporation
SHUI Model Overview
Gaylon Campbell, Washington State University soil scientist and STEEP researcher, has been involved in the STEEP effort to develop computer models for simulating water budgets, soil erosion and crop production potential under varying management systems. One of the latest models is called SHUI (the Chinese word for water). It was developed with the help of Ying Yan, soils research assistant. The purpose of the model is to provide a simple, realistic, integrated tool for evaluating tillage systems and their influence on factors related to soil loss and crop production potential.
The SHUI model was developed by adapting and integrating three existing models developed in the Northwest: a soil-water balance model to predict soil water storage and losses to runoff, evaporation and deep percolation under different management systems; a C-factor (crop management factor in the Universal Soil Loss Equation) evaluation model to predict soil erosion losses under different tillage-residue management systems; and a residue decomposition model to predict residue losses from microbial decomposition under different systems.
Residue cover and crop canopy play important roles introducing erosion, To predict how erosion is affected by the residue management system, the model estimates how much residue is produced, the fraction of soil covered by residue and/or crop canopy, the soil water status and other related soil factors. The residue left on the ground is buried by tillage operations and gradually decomposed. The modeling of these processes is particularly important because the residue mulch reduces erosion and helps reduce loss of precipitation by runoff and evaporation.
The C-factor is determined from five components calculated in the model: surface residue, incorporated residue, green crop cover, surface soil detachability and roughness, and soil moisture factors. The relationships of these factors and the soil erosion potential were developed through long-term experiments by Don McCOO1, USDAARS agricultural engineer, who adapted the USLE to dryland agriculture in the Northwest. The model helps evaluate the erosion potential of different crop rotations and tillage systems.
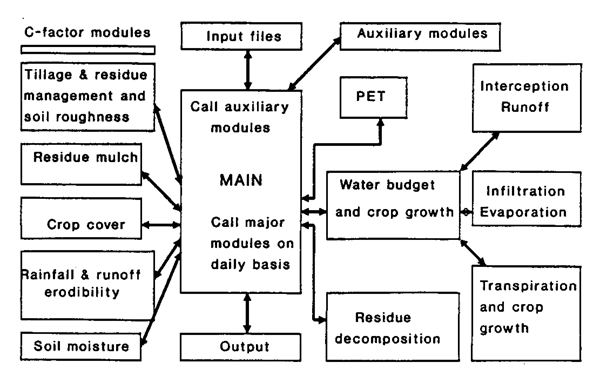
In the SHUI model, Campbell and Yan have placed an emphasis on the soil-water budget, crop rotation and residue management aspects of the system. The model is written in Turbo Pascal and is designed to run on a personal computer. A diagram of the model is shown in Fig. 3. The model runs on a daily time step, taking approximately 30 seconds to simulate 1 year. The model requires inputs of daily weather data, soil properties and management practices. The main body of the program calls modules to compute the soil-water budget, above-ground dry matter production, residue loss and soil loss (C-factor).
Soil-Water Budget
The amount of water available for crop growth can be determined by modeling the components of the soil-water budget. The budget components considered in the module are: precipitation, rainfall interception by the crop surface, runoff, infiltration, evaporation from both soil and residue mulch, transpiration of water from the crop, deep percolation and water storage in the soil profile. Soil water is assumed to be available for plant uptake if the soil water content is greater than that held at the permanent wilting point for the particular soil.

This paper will focus on demonstrating the model for predicting evaporative loss of overwinter precipitation, illustrating only one component of the soil-water budget.
Potential Soil Water Evaporation
The term potential ”evapotranspiration” represents the potential combined vapor loss of water through transpiration by the crop and evaporation from the soil, surface residue and crop canopy surface. Potential evapotranspiration is calculated from estimates of solar radiation, daily maximum and minimum temperatures, and several other environmental factors. When no crop is present for transpiration of water, potential evaporation is calculated from the precipitation absorbed by the surface residue (about 4 times the weight of the residue at saturation) and that which passes through the residue for storage in the soil.
Examples of Evaporation Prediction
To help understand the impacts of different tillage practices and surface residue levels on overwinter water loss by evaporation, three model runs are shown from September, after winter wheat harvest, to the end of March using 39 years of weather data from 1948 to 1987. Three Washington locations representing contrasting precipitation zones and winter wheat residue production potentials are used as examples (Table 2).
Similar losses of overwinter precipitation by evaporation were predicted after the moldboard plow at the three locations. With standing and chiseled wheat stubble, however, evaporative losses decreased as residue and precipitation levels increased from Lind to Pullman.
The difference in evaporative losses under standing stubble and chiseled stubble generally averaged less than 0.5 inches at the three locations. Compared to chiseled stubble, plowed cropland lost an average of 1.4 inches more water to evaporation at Lind, 2.2 inches at LaCrosse and 3.0 inches at Pullman.
Table 2. Simulated average evaporation of overwinter precipitation under standing, plowed and chiseled winter wheat stubble during September to April (1948-87) at three eastern Washington Locations with contracting precipitation and residue production zones using the SHUI model, 1989 (Campbell and Yan, WSU).
| Locations and Stubble Treatment | Annual Precip. Zone (inches) | Initial Residue Level (lb/acre) | September through April Evaporation | ||
|---|---|---|---|---|---|
| Maximum | Minimum | Average | |||
| (inches) | |||||
| Pullman | 20 | 9,000 | |||
| Plowed | 4.6 | 1.8 | 3.4 | ||
| Chiseled | 0.5 | 0.2 | 0.4 | ||
| Standing | 0.2 | 0.1 | 0.1 | ||
| LaCrosse | 14 | 6,000 | |||
| Plowed | 4.9 | 1.4 | 2.9 | ||
| Chiseled | 1.1 | 0.4 | 0.7 | ||
| Standing | 0.6 | 0.3 | 0.4 | ||
| Lind | 9 | 2,500 | |||
| Plowed | 4.9 | 1.3 | 3.4 | ||
| Chiseled | 3.1 | 0.6 | 2.0 | ||
| Standing | 2.5 | 0.5 | 1.5 | ||
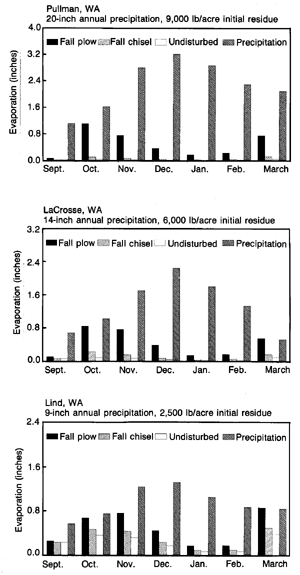
Fig. 4 shows the average precipitation and simulated average evaporative water losses per month from September to April (1948-87) under the three stubble treatments. Note that substantial water losses to evaporation occur in the fall and as temperatures increase again in March. Water losses are relatively low during the winter months of January and February because of low potential evaporation and the increased presence of snow cover and frozen soils.

It is important to remind the reader that these estimates of evaporation presented here are unverified computer model calculations. These estimates do, however, tend to confirm field research observations. They are also useful in helping to improve our understanding of the impacts of management options, as well as to point out areas of future research needs.
Summary and Implications
These field research and computer simulated examples provide a relatively consistent range of estimated evaporation losses of overwinter precipitation under different tillage and residue management systems. From 1 to 3 inches more evaporation of overwinter precipitation is estimated to occur where a majority of the residue from the previous crop was buried by plowing or was burned than where the stubble was chiseled or left standing overwinter, or where winter wheat was seeded under a conservation tillage system. Variations in the data generally reflected differences in the number of months evaluated for soil water storage, surface residue amounts, precipitation zones and distribution through the year, yearly climatic fluctuations and other factors.
The results of these and associated research efforts indicate that where available water is an important yield limiting factor in dryland crop production in the Northwest, producers should seriously consider the impacts of their tillage and residue management practices on the potential for evaporation of overwinter precipitation. A 1 to 3 inch reduction in evaporation of overwinter precipitation where a portion of the crop residue is maintained on the soil surface could substantially increase yield potentials and profit margins. At the same time, the residue would be providing effective control of surface runoff and erosion.
Management strategies for pest control, soil fertility maintenance and other production considerations under conservation tillage must obviously be in place, however, to effectively utilize the additional stored soil water. In areas where runoff on frozen soil is a common problem, a fall tillage operation, such as chiseling, could reduce surface runoff of overwinter precipitation sufficiently to more than offset the small increase in precipitation loss by evaporation compared to standing stubble.
Field research will continue to be a vital component in identifying and verifying differences in water losses by runoff, evaporation and deep percolation under different management systems. However, computer modeling promises to be a very useful tool for quickly evaluating production management options under the variable Northwest climatic conditions and soils.