Straw Production and Grain Yield Relationships in Winter Wheat
Chapter 3 – Residue Management Considerations, June 2000
Authors: Edwin Donaldson, former WSU wheat breeder, * William Schillinger, dryland research agronomist, WSU, Lind; and Steve Dofing, former WSU extension agronomist. *Corresponding author phone 509-659-0355 and e-mail (schillw@wsu.edu).
Common Abbreviations: D- sowing date; HI – harvest index; HPU – heads per unit area; HRWW – hard red winter wheat; KPH – kernels per head, R – sowing rate; SWWW – soft white winter wheat; KW – kernel weight; V – variety.
Abstract
Winter wheat (Triticum aestivum L.) – fallow is the predominant cropping system in low-precipitation (less than 10 inches annual) regions of the inland Pacific Northwest (PNW) of the USA. Wind erosion is a recurrent problem when crop residue, the main source of soil protection, is lacking. Management options that optimize both grain yield and straw production are needed. A 3-year field study was conducted to determine sowing rate and sowing date effects on straw and grain yield, and grain yield components, of winter wheat varieties with semidwarf, standard height, or tall growth habit. Four winter wheat varieties were evaluated at three sowing rates (20, 40, and 60 lb/acre) and three sowing dates in August, September, and October. The greatest effect of sowing date was on straw production. Straw biomass from mid-August sowing averaged 2.99 ton/acre compared with 2.08 and 1.24 ton/acre from mid-September and mid-October sowing, respectively. Grain yield was highest for mid-August sowing during two years and lowest for mid-October sowing all years. Averaged across years, the semidwarf variety produced the highest grain yield on all sowing dates and was equal to the standard height and tall varieties for straw production. Path coefficient analysis showed that variation in grain yield was due primarily to differences in heads per unit area (HPU) and kernels per head (KPH). Late sowing resulted in a large reduction in HPU and, therefore, grain yield. For cropland susceptible to wind erosion in east-central Washington, early sowing results in increased wheat straw production and generally higher grain yield compared with mid to late sowing dates.
Introduction
Maintenance of surface residue is often the only protection against wind erosion on poorly aggregated soils in the 6-to 10-inch annual precipitation dryland wheat production zone of east-central Washington, USA. Winter wheat-fallow is the dominant cropping pattern, and growers often have difficulty maintaining the minimum (350 lb/acre) surface residue required for farm program compliance, due to low quantities produced and intensive fallow tillage (Papendick, 1998). In most years, fallow allows growers to sow winter wheat in mid-to-late August into carryover soil water, but sowing sometimes must be delayed due to insufficient seed-zone soil water (Schillinger et al., 1998), or the need to control winter annual grass weeds (Ogg, 1993). Early stand establishment is an important factor for increasing grain yield, and it is strongly influenced by seed-zone water content and depth of soil covering the seed (Lindstrom et al., 1976). Because of frequent dry seed-zone conditions and the need to emerge from deep sowing depths, tall and standard height varieties predominate in east-central Washington, while only the best-emerging semidwarf varieties are grown (Donaldson, 1996).
Harvest index is defined as percentage grain in the total plant biomass. Genetic improvement of grain yield in winter wheat has been closely associated with increases in harvest index, but not with increases in total biomass (Slafer and Andrade, 1991). Thus, the adoption of semidwarf wheat varieties is due to their increased biological efficiency, as these shorter varieties tend to produce less straw per unit of grain than conventional height varieties. Wallace et al. (1993) warned that the trend of achieving higher grain yield by increasing harvest index is not sustainable, and recommended total biomass be considered in breeding programs to assure long-term yield improvement.
Sowing rate and date effects on grain yield of wheat have been reported from major wheat producing regions in the USA and Canada (Paulsen, 1987). Of the three grain yield components (head number per unit area, kernels per head, and kernel weight (KW), HPU and KPH generally are the most important determinants of grain yield (Knapp and Knapp, 1978; Shah et al., 1994). Although KW does exert an influence on grain yield, numerous sowing rate experiments have demonstrated that its influence is generally smaller than that of HPU or KPH (Guitard et al., 1961; Shah et al., 1994). Maximum grain yield results from an optimum balance of the three yield components, which are competing for fixed resources during critical stages of development. Higher sowing rates in wheat result in increased HPU and associated decreases in KPH (Johnson et al., 1988) due to yield component compensation. Tompkins et al. (1991) found that the increase in HPU with higher sowing rate was proportionately greater than the decrease in KPH.
In the Pacific Northwest, early sowing of winter wheat is associated with high HPU, high kernel wt, and low KPH (Thill et al., 1978). Reduced inter-plant competition related with low sowing rates generally results in concomitant increases in KPH and KW; however, these may not fully compensate for low HPU (Joseph et al., 1985). The relative contribution of HPU on grain yield becomes less important with delayed sowing (Blue et al., 1990). Baker (1982) found that varieties varied in their response to sowing rate, but with the best grain yields generally from the highest sowing rate and highest harvest index from the intermediate sowing rate. Ciha (1983) observed yield reduction in the PNW with higher sowing rates due to increased lodging; however, this is generally limited to areas receiving more than 15 inches annual precipitation.
Emphasis on the need to reduce water and wind erosion has heightened the importance of maintaining protective residue in crop production systems. Wheat varieties grown in dryland areas of the PNW vary greatly in plant height and may differ in residue production and harvest index. Few previous studies have assessed both grain yield and straw production in low-precipitation environments. This study was conducted to determine the best combination of sowing rate and sowing date in semidwarf, standard height, and tall winter wheat varieties on straw production, grain yield, and yield components.
Materials and Methods
A 3-yr study involving the 1994-1995, 1995-1996, and 1996-1997 growing seasons was conducted at the Washington State University Dryland Research Station at Lind, Washington. Annual precipitation at the site averages 9.61 inches (Table 1). The soil is a Shano silt loam (coarse-silty, mixed, superactive, mesic Xeric Haplocambids) which has less than 1% organic matter in the surface 4 inches. The Shano soil is considered one of the most susceptible to wind erosion and to suspended dust emissions in the Columbia Plateau of eastern Washington (Stetler and Saxton, 1996).
Table 1: Precipitation at Lind, Washington, during the study period and long-term average.
| Month | 1993-1994† | 1994-1995 | 1995-1996 | 1996-1997 | 80-yr avg. |
|---|---|---|---|---|---|
| ----------------------------------------------------------inches----------------------------------------------------------- | |||||
| August | 0.39 | 0.00 | 0.24 | 0.00 | 0.35 |
| September | 0.00 | 0.24 | 0.83 | 0.20 | 0.55 |
| October | 0.51 | 1.46 | 1.10 | 2.24 | 0.87 |
| November | 0.24 | 1.54 | 1.18 | 2.48 | 1.26 |
| December | 1.30 | 1.30 | 1.89 | 1.89 | 1.26 |
| January | 1.30 | 1.89 | 1.61 | 2.01 | 1.02 |
| February | 0.31 | 1.06 | 1.50 | 0.87 | 0.87 |
| March | 0.04 | 2.20 | 0.39 | 1.38 | 0.83 |
| April | 1.02 | 0.94 | 0.98 | 0.98 | 0.71 |
| May | 1.54 | 0.31 | 1.10 | 1.06 | 0.79 |
| June | 0.28 | 1.65 | 0.47 | 0.91 | 0.79 |
| July | 0.20 | 0.59 | 0.04 | 0.83 | 0.31 |
| Annual Total | 7.13 | 13.19 | 11.34 | 14.84 | 9.61 |
| † 1993-1994 was the fallow year prior to beginning the experiment. | |||||
Treatments consisted of four winter wheat varieties evaluated at three sowing rates and three sowing dates. Varieties were Buchanan, Hatton, Moro and Eltan; sowing rates were 6, 12, and 18 seeds ft2 (approximately 20, 40, and 60 lb/acre); and sowing dates were approximately 20 August, 16 September, and 21 October. Sowing dates for each month varied by a few days among years (1994 to 1996).
The experimental design was a split plot in randomized complete block arrangement. Main plots were sowing dates, and subplots consisted of the variety x sowing rate combinations. Buchanan and Hatton are tall and standard height hard red winter wheat (HRWW) varieties, respectively. Moro is a standard height, club-head, soft white winter wheat (SWWW), and Eltan is semidwarf, common-head, SWWW. Hatton has stiff straw, mid-sized heads, and moderate tillering. Buchanan and Eltan have a finer, more limber straw, smaller heads, and profuse tillering. Moro has large heads, large diameter straw, and low-to-moderate tillering. These varieties are representative of the different market classes and phenotypes grown in the low-precipitation dryland cropping region of the inland PNW.
Plots were prepared during the fallow cycle each year by: application of 16 oz/acre glyphosate for weed control in early March, primary tillage with a wide-blade V-shape sweep in mid-March, application of 45 lb N per acre as anhydrous NH3 in April, and 2 or 3 rodweeding operations as needed to control Russian thistle (Salsola iberica Sennen and Pau) and other weeds from May to August. Plot locations among years were separated by less than 600 feet.
Soil water content in the total 6 foot profile in mid-August was measured in 6-inch increments using neutron attenuation (Gardner, 1986). Seed-zone water content at time of sowing (August and September only) was determined gravimetrically in 1-inch increments to a depth of 9 inches using an incremental soil sampler. For both total soil profile and seed zone water measurements, five samples within the plot area were taken and averaged to obtain each value.
Certified seed of all four varieties was treated with difenoconozole fungicide. Each 20 ft-long x 10 ft-wide plot was sown with a deep-furrow split-packer drill with 16 inch spacing between rows. Broadleaf weeds were controlled during the growing season with bromoxynil applied at 0.35 lb ai per acre in mid-April. Weeds that germinated subsequently were removed by hand.
In late July, mature plants from 3-ft row sections from each plot were clipped and head number per unit area (HPU) determined. Heads were threshed and a subsample was used to determine 1000 kernel wt., using an electronic seed counter. Kernels per head was calculated from the thousand kernel wt. and HPU. Grain yield and straw production was determined by taking a 4 foot swath (outside of the hand-sample area) through each plot with a plot combine. The combine cutting bar was operated at ground level and residue was collected on a tarp attached to the back of the combine, then weighed.
An analysis of variance was conducted in which all effects were considered fixed. Path analysis was performed to quantify causal effects among variables (Loehlin, 1987). Path coefficients are standardized regression coefficients, and have the same interpretations as regression coefficients except that they are expressed in standard deviation units.
Results and Discussion
Precipitation and Soil Water
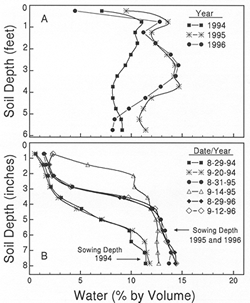
Precipitation during the study was greater than the long-term average, except for the 1993-1994 fallow cycle, which was drier than average (Table 1). Available water for winter wheat in the 6-ft soil profile at the end of fallow in mid-August was 2.16, 4.53, and 3.74 inches in 1994, 1995, and 1996, respectively (Fig 1a). Soil water content at depth of seed placement for August and September was 11.5, 12.7, and 13.4% by volume in 1994, 1995, and 1996, respectively. Seed-zone water content was barely sufficient for stand establishment in August and September of 1994 (minimum 11% by volume required, Lindstrom et al., 1976) but was quite adequate in 1995 and 1996 (Fig 1b). Depth of soil covering the seed was 6.3 inches in 1994, 3.9 inches 1995, and 3.9 inches in 1996. Sowing during October in all years occurred after the surface soil had been wetted by rain and only 1 inch of soil covered the seed. Wheat survived the relatively mild winters with little or no cold damage.
Sowing Rates, Sowing Dates, and Varieties
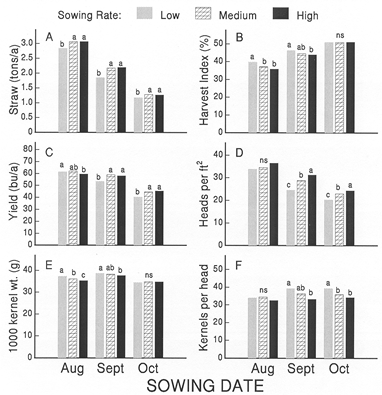
Altering sowing rate caused significant changes in all variables measured (Table 2), and effects were consistent across varieties, as the variety x sowing rate interaction was not significant for any trait. Apparently, effects on plant growth and development resulting from sowing rate were so large that they masked any genotypic differences that might cause varieties to respond differently. Grain yield was not decreased by low sowing rate in August, but was reduced compared with medium and high sowing rates in September and October (Fig 2c). The low sowing rate reduced straw production at all sowing dates, but straw production was similar at medium and high sowing rates (Fig. 2a ). Harvest index was generally highest for low sowing rate in August and September, but had no effect in October (Fig. 2b). There were no differences in HPU (Fig. 2d) among sowing rates for August sowing, but HPU rose incrementally with increased sowing rate for the September and October sowing dates. Sowing rate had no influence on KPH for the August sowing, but KPH decreased incrementally for the September and October sowing dates (Fig. 2f). Higher sowing rates caused a slight decrease in KW in the August and September sowing dates, but had no effect in October (Fig. 2e).
Table 2. Analysis of variance for straw production, grain yield, and yield components for four winter wheat varieties sown on three dates and at three sowing rates at Lind, WA, for three crop years from 1994-1997.
| Source | df | Straw wt | Heads ft2 | Kernels per head | Kernel wt | Grain yield | Harvest index |
|---|---|---|---|---|---|---|---|
| Year (Y) | 2 | ||||||
| Date (D) | 2 | ** | ** | ** | ** | ** | |
| Rep (Y D) | 27 | ||||||
| Variety (V) | 3 | ** | ** | ** | ** | ** | ** |
| Rate (R) | 2 | ** | ** | ** | ** | * | ** |
| CxR | 6 | ||||||
| YxC | 6 | ** | ** | * | ** | ** | ** |
| YxR | 4 | ** | ** | ||||
| CxD | 6 | * | ** | ** | * | ||
| RxD | 4 | ** | ** | ** | |||
| YxD | 4 | ** | ** | ** | |||
| YxCxR | 12 | * | |||||
| YxCxD | 12 | ** | * | ** | ** | ** | |
| CxRxD | 12 | ||||||
| YxRxD | 8 | ** | ** | ** | |||
| YxCxRxD | 24 | * | |||||
| *,** Significant at the 5% and 1% probability levels, respectively. Blank values indicates no significant effect. | |||||||
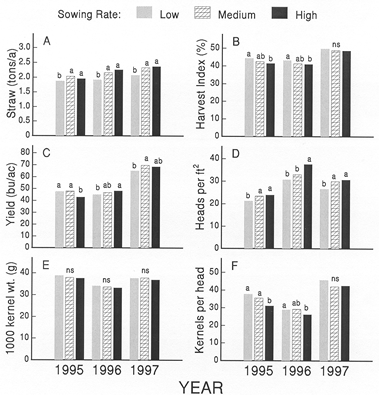
For both grain yield and straw production, the effects of sowing rate depended on the year in which the crop was grown, as indicated by the significant year x sowing rate interaction for those variables (Table 2). Maximum grain yield was obtained from the low and medium sowing rates in 1995, and from the medium and high rates in 1996 and 1997 (Fig. 3c). In all years, the low sowing rate resulted in the lowest straw production (Fig. 3a) and lowest HPU (Fig. 3d). There were no differences in KW within any year (Fig. 3e), and KPH for the low rate was equal to or greater than that of the higher sowing rates (Fig 3f).
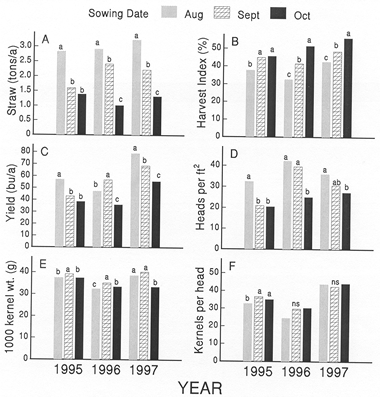
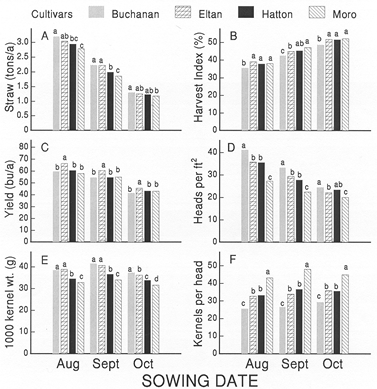
Marked increases in straw production always resulted from early sowing, more than doubling straw produced from the October sowing in all years (Fig. 4a). The quantity of straw decreased about 30% per month, being 71% and 42% of the August amount for September and October, respectively. Harvest index was inversely related to straw production, i.e., early sowing always resulted in the lowest HI (Fig. 4b). Grain yield was highest with early sowing in 1995 and 1997 and better than October sowing in all years (Fig. 4c). Heads per unit area was consistently higher for August vs. October sowing and was also higher compared with September sowing in 1995 (Fig. 4d). There were no consistent sowing date relationships in KW or KPH (Fig. 4e and 4f).
All varieties consistently produced less straw as sowing date was delayed (Fig. 5a). However, the significant variety x date interaction for straw production, along with HPU, KW, and harvest index (Table 2), indicates that variety effects differ across sowing dates. Moro generally produced the least straw, but not significantly less than Hatton in two years. Harvest index was consistently low with the tall variety Buchanan (Fig. 5b). Grain yield was always highest for the semidwarf Eltan, whereas there were no differences between Hatton and Moro on any sowing date (Fig. 5c). Moro invariably had the lowest HPU (Fig. 5d) and KW (Fig. 5e), but compensated with high KPH (Fig. 5f). Conversely, Buchanan consistently produced an abundant number of heads with high KW, but with low KPH.
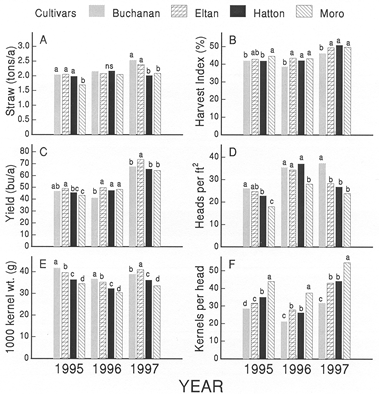
Averaged across sowing dates and rates, straw production (Fig. 6a) remained relatively constant (within 0.7 tons per acre) among varieties within each year. Buchanan had a lower HI than any other variety in 1996 and 1997 (Fig. 6b). Eltan produced the overall highest grain yield, but there was no consistent trend (Fig. 6c). Similar to the sowing rate x variety comparisons in Fig. 5, Moro always had the lowest HPU (Fig. 6d) and KW (Fig. 6e), but compensated with the greatest KPH (Fig. 6f).
Path coefficient analysis (data not shown) demonstrated that grain yield was a function primarily of HPU and KPH, with less influence from KW. Higher HPU induced a large decrease in KPH, and a small reduction in KW. Higher KPH resulted in relatively large decreases in KW. Data from this model underscore the importance of HPU in the determination of grain yield under low-precipitation conditions.
Summary
Residue is often the only defense against wind erosion in the low-precipitation wheat-fallow region of the inland Pacific Northwest. Early sowing of winter wheat always resulted in the most straw production and also the highest grain yield in two out of three years. Straw production and grain yield were consistently lowest with late sowing. The low sowing rate resulted in reduced straw production on all sowing dates and also the lowest grain yield on the medium and late sowing dates.
When seed zone water is limiting, growers in east-central Washington are advised to sow early in mid-to-late August with a standard height or tall variety to better achieve a satisfactory plant stand. When seed zone water is adequate, and when production of straw is not a determining factor, sowing may generally be delayed until mid September without yield penalty. Provided that adequate plant stands are achieved, semidwarf varieties will likely produce as much straw, and greater grain yield, compared with standard height and tall varieties.
Acknowledgements
Funding for this study was provided by the Columbia Plateau Wind Erosion/Air Quality Project.
References
Baker, R.J. 1982. Effect of seeding rate on grain yield, straw yield, and harvest index of eight spring wheat cultivars. Can. J. Plant Sci. 62:285-291.
Blue, E.N., S.C. Mason, and D.H. Sander. 1990. Influence of planting date, seeding rate, and phosphorus rate on wheat yield. Agron. J. 82:762-768.
Ciha, A.J. 1983. Seeding rate and seeding date effects on spring seeded small grain cultivars. Agron J. 75:795-799.
Donaldson, E. 1996. Crop traits for water stress tolerance. Am. J. Altern. Agric. 11:89-94.
Frederick, J.R. and H.G. Marshall. 1985. Grain yield and yield components of soft red winter wheat as affected by management practices. Agron. J. 77:495-499.
Gardner, W.H. 1986. Water content. p. 493-544. In A. Klute (ed.) Methods of soil analysis. Part 1. 2nd ed. Agron. Monogr. 9. ASA and SSSA, Madison, WI.
Guitard, A.A., J.A. Newman, and P.B. Hoyt. 1961. The influence of seeding rate on the yield and the yield components of wheat, oats, and barley. Can. J. Plant Sci. 41:751-758.
Johnson, J.W., W.L. Hargrove, and R.B. Moss. 1988. Optimizing row spacing and seeding rate for soft red winter wheat. Agron J. 80:164-166.
Joseph, K.D.S.M., M.M. Alley, D.E. Brann, and W.D. Gravelle. 1985. Row spacing and seeding rate effects on yield and yield components of soft red winter wheat. Agron. J. 77:211-214.
Knapp, W.R. and J.S. Knapp. 1978. Response of winter wheat to date of planting and fall fertilization. Agron. J. 70:1048-1051.
Lindstrom, M.J., R.J. Papendick, and F.E. Koehler. 1976. A Model to predict winter wheat emergence as affected by soil temperature, water potential, and depth of planting. Agron. J. 68:137-141.
Loehlin, J.C. 1987. Latent variable analysis: An introduction to factor, path, and structural analysis. Lawrence Erlbaum Assoc., Hillsdale, N.J.
Ogg, A.J. Jr. 1993. Control of downy brome (Bromus tectorum) and volunteer wheat (Triticum aestivum) in fallow with tillage and pronomide. Weed Tech. 7(3):686-692.
Papendick, R.I. (Editor) 1998. Farming with the wind: Best management practices for controlling wind erosion and air quality on Columbia Plateau croplands. Washington State Univ. College of Agric. and Home Econ. Misc. Pub. no. MISCO208.
Paulsen, G.M. 1987. Wheat stand establishment. p. 384-389. In E.G. Heyne (ed.) Wheat and wheat improvement. Agron. Monogr. 13. 2nd ed. ASA, CSSA, and SSSA, Madison, WI.
Schillinger, W.F, E. Donaldson, R.E. Allan, and S.S. Jones. 1998. Winter wheat seedling emergence from deep sowing depths. Agron J. 90:582-586
Shah, S.A., S.A. Harrison, D.J. Boquet, P.D. Colyer, and S.H. Moore. 1994. Management effects on yield and yield components of late-planted wheat. Crop Sci. 34:1298-1303.
Slafer, G.A., and F.H. Andrade. Changes in physiological attributes of the dry matter economy of bread wheat (Triticum aestivum) through genetic improvement of grain yield potential at different regions of the world. Euphytica 58:37-49.
Stetler, L.D., and K.E. Saxton. 1996. Wind erosion and PM10 emissions from agricultural fields on the Columbia Plateau. Earth Surface Processes and Landforms 21:673-685.
Tompkins, D.K., G.E. Hultgreen, A.T. Wright, and D.B. Fowler. 1991. Seed rate and row spacing of no-till winter wheat. Agron. J. 83:684-689.
Thill, D.C., R.E. Witters, and R.I. Papendick. 1978. Interactions of early-and late-planted winter wheat with their environment. Agron. J. 70:1041-1047.
Wallace, D.H., J.P. Baudoin, J. Beaver, D.P. Coyne, D.E. Halseth, P.N. Masaya, H.M. Munger, J.R. Myers, M. Silbernagel, K.S. Yourstone, and R.W. Zobel. 1993. Improving efficiency of breeding for higher crop yield. Theor. Appl. Genet. 86:27-40.